AerYield.
Helping agriculture manage ozone impacts.
We quantify and forecast how ozone silently reduces yields – crop by crop, field by field, year by year.

Climate change and wildfires drive ozone levels up. Rising ozone levels silently drive crop yields down. And each region faces its own seasonal ozone pattern. We support agricultural decision-makers with insights that improve profitability and reduce risk.
The problem
Yield loss you can’t see
Farmers lose yield every year to ground-level ozone, but they can’t see it, measure it, or manage it.

Invisible & chronic
Unlike drought, or hail, ozone damage leaves no visible signs and accumulates across the growing season silently

Highly variable
Yield losses vary strongly by location and year. Ozone damage depends on local pollution, weather, crop sensitivity, and seasonal conditions.

Economically material
Yield losses of 5–25% for sensitive crops.
Billions in lost revenue annually across major farming regions.
Despite decades of academic research, the damage stays invisible and unmanaged at the farm level.
Why this problem is growing
Ozone is a resurgent problem for the agricultural sector.
Crop yields are under threat, and ozone is a missing driver
Our Solution is AerYield
AerYield quantifies ozone-driven yield losses by crop and location, so customers can compare options and reduce risk.


Ozone-related yield loss by location
Same crop, different locations
2025

Ozone-related yield loss by crop
Same location, different crops
2025
What AerYield delivers
Who it’s for
One problem, multiple stakeholders
Farmers
Unaware of how this pollutant affects their crops. This causes uncertainty in crop decisions.
What farmers already manage:
What farmers can’t see:

OTHER CUSTOMERS

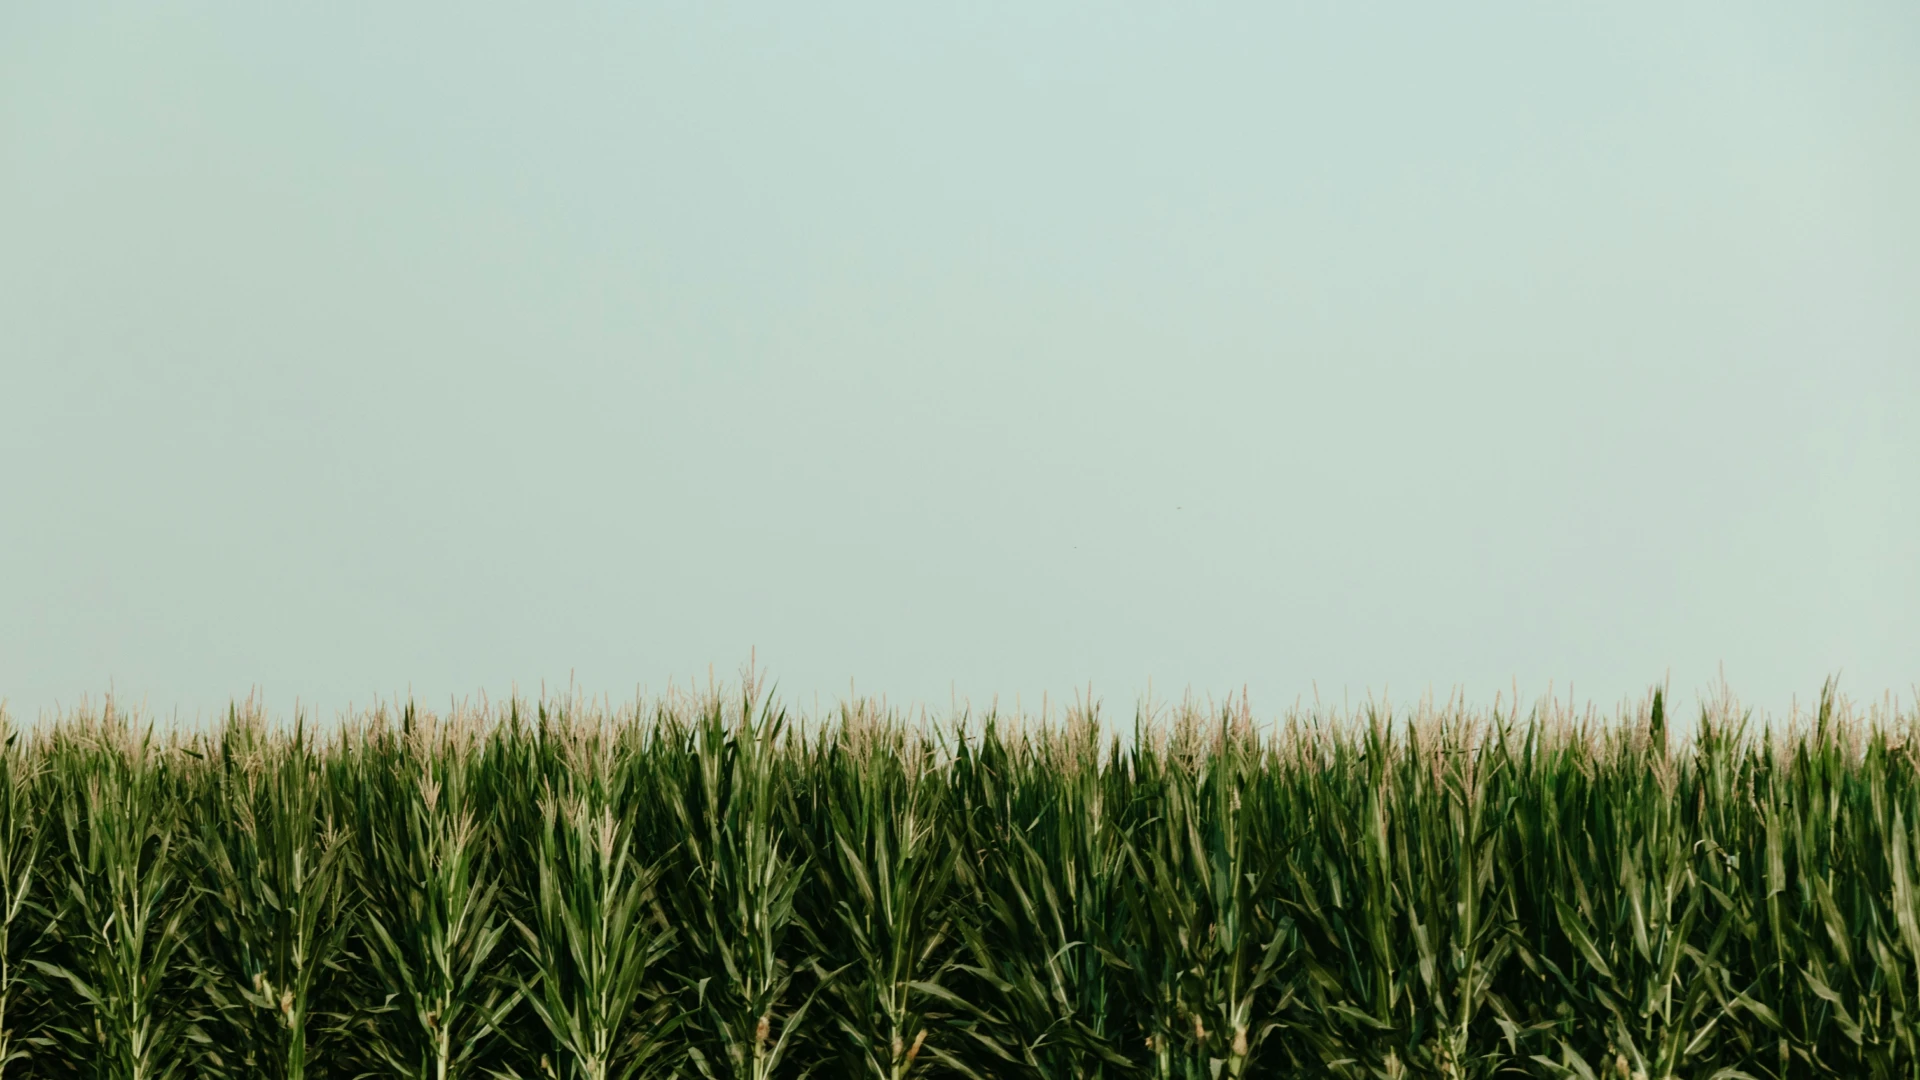
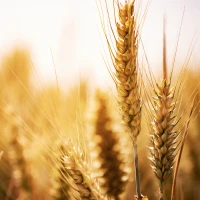
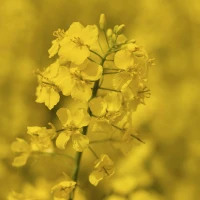
Crops covered
by AerYield
Products for farmers
AerYield OPTION 1
Provide Your Location.
Get Actionable Crop Insights.
Localized insights for smarter crop decisions – powered by our satellite data.
from USD 100 / EUR 80

HOW IT WORKS
- Select locations
- Choose crops & growing season
- Receive customized report
WHAT’S INCLUDED
- Historical yield losses
- Forecasted future yield losses
- Side-by-side comparisons
- Flexible pricing based on the number of locations and crops selected.
AerYield OPTION 2
Bring Your Own Data for Maximum Precision.
Hyper-localized insights for smarter crop decisions – powered by your data and our satellite intelligence

KEY BENEFITS
- Integrates public or on-farm sensors
- Works with incomplete datasets
- Scales local data with our satellite intelligence
WHAT’S INCLUDED
- All features of AerYield Option 1
- Support in finding and accessing the nearest suitable public sensor, or support in deploying on-farm sensors
- Customised offers and pricing
Explore Our Case Studies
Project annual yield loss due to ozone
Pro Valley crop choice: Wheat vs Maize
2025 — 2050

Hourly excess ozone during growing
seasons during daylight

Project annual yield loss due to ozone
Large European Multisite Farm
2025 — 2050

The Technology
How AerYield Works
Field input & context setup
Users start by selecting the location of their fields, along with the crops grown and the relevant growing season.
This defines the spatial and temporal context for the analysis, ensuring that all calculations are specific to each farm’s real-world conditions.


Ozone exposure & yield loss modelling
AerYield combines satellite air quality data with environmental models to calculate cumulative ground-level ozone exposure above a harmful threshold (40 ppb) for every hour of daylight in the growing season.
Crop-specific yield losses are then estimated using peer-reviewed relationships between ozone exposure and crop sensitivity.

Decision-ready insights & dashboard
Results are delivered through an interactive dashboard that turns ozone exposure into actionable insights.
Users can identify the most affected fields and crops, track changes over time, and explore how future risks may evolve.


FAQs
mais logo